I recently had to deal with an absolute pain of an issue that was 503ing production on an increasingly frequent basis. In about December of last year I moved our frontend deployment to https://seed.run (which under the hood uses AWS Cloudformation) on the grounds that https://vercel.com were totally screwing us on bandwidth overages at $40 per 100GB increment, which racked up into thousands due to a successful (measured by hits, conversions is another thing...) marketing campaign
Anyway everything looked good on the deployment migration for months, but then every now and then we'd get this message:

This is caused by the Next.js server lambdas throwing an unhandled error, or timing out, though we never really know why because right now trying to find the logs in Cloudwatch is a complete effort in futility - fuck Cloudwatch.
Interestingly it only seemed to occur around the point of doing a release / incremental static regeneration. I thought maybe there was some downtime between AWS shifting over resources to the domain or something - I'm not super familiar with how Cloudformation does things... anyways I was too busy with migrating us to billing platforms, and the infrequency / difficulty to reproduce made it hard to diagnose / fix...
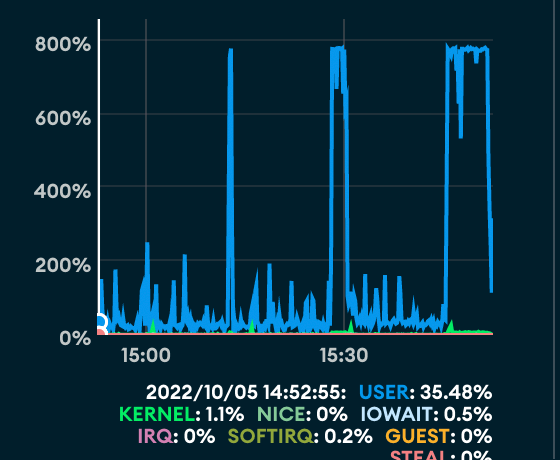
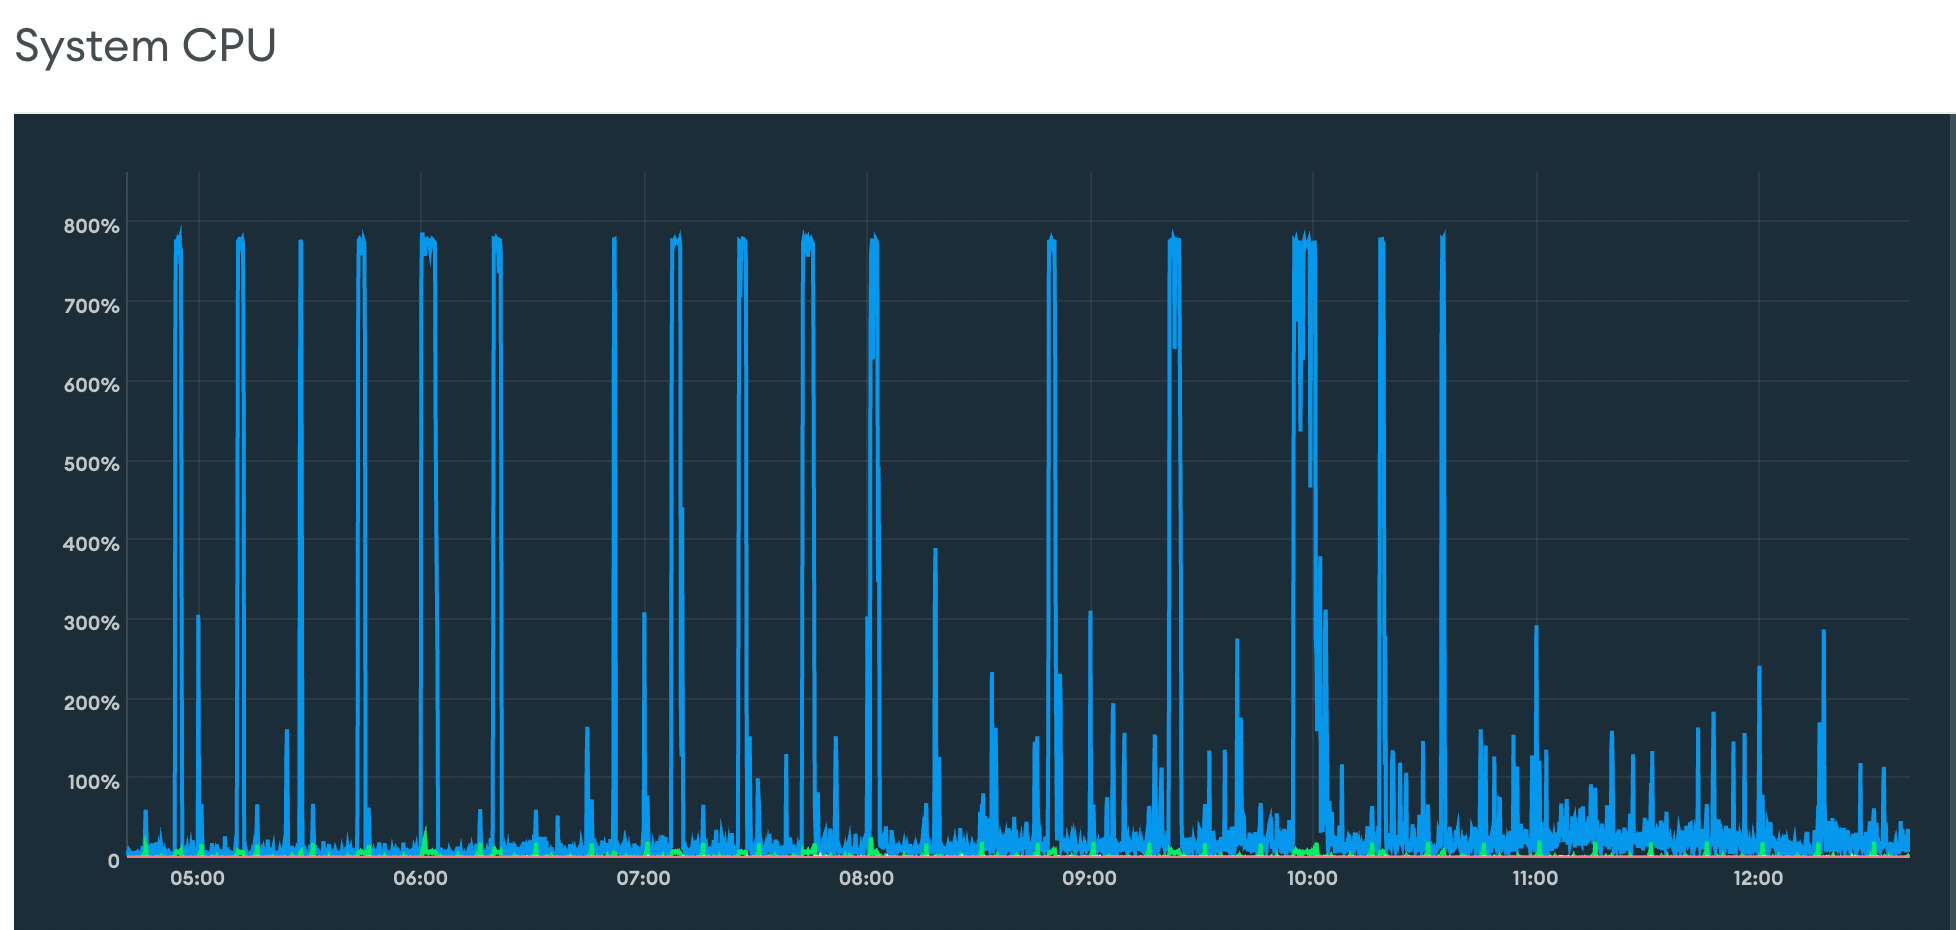
A few months pass and this was getting worse, to the point where every release would cause this 503ing for upwards of 15 minutes each time. At one point whilst in the office I was scrambling to try and get things back up, taking a look into the metrics of our services revealed that our MongoDB clusters CPU was getting absolutely thrashed:

Looking at the the query logs I found that almost all the CPU was taken up by an aggregation pipeline which summed up subdocument values across all users, an expensive operation, but done infrequently enough that it's not an issue, besides the pipeline is only used in a couple places, and there's caching in place where it was being used. So why were there so many queries for it? Was the caching layer not working? Was something about the URL causing cache misses & someone was un/intentionally trying to do this?
As a temporary measure I put some static values in place of the aggregation return value, we'd have stale values for a bit, but that was better than the site 503ing & I'd have to come back to this when capacity allowed.
The problem
While working on an higher priority unrelated ticket I noticed something super interesting that just instantly clued me in on what was happening. With my work on moving us across billing platforms I sank some time into improving our logging, one part of which was adding https://www.npmjs.com/package/morgan to log out network requests, the path, how long they were taking etc.
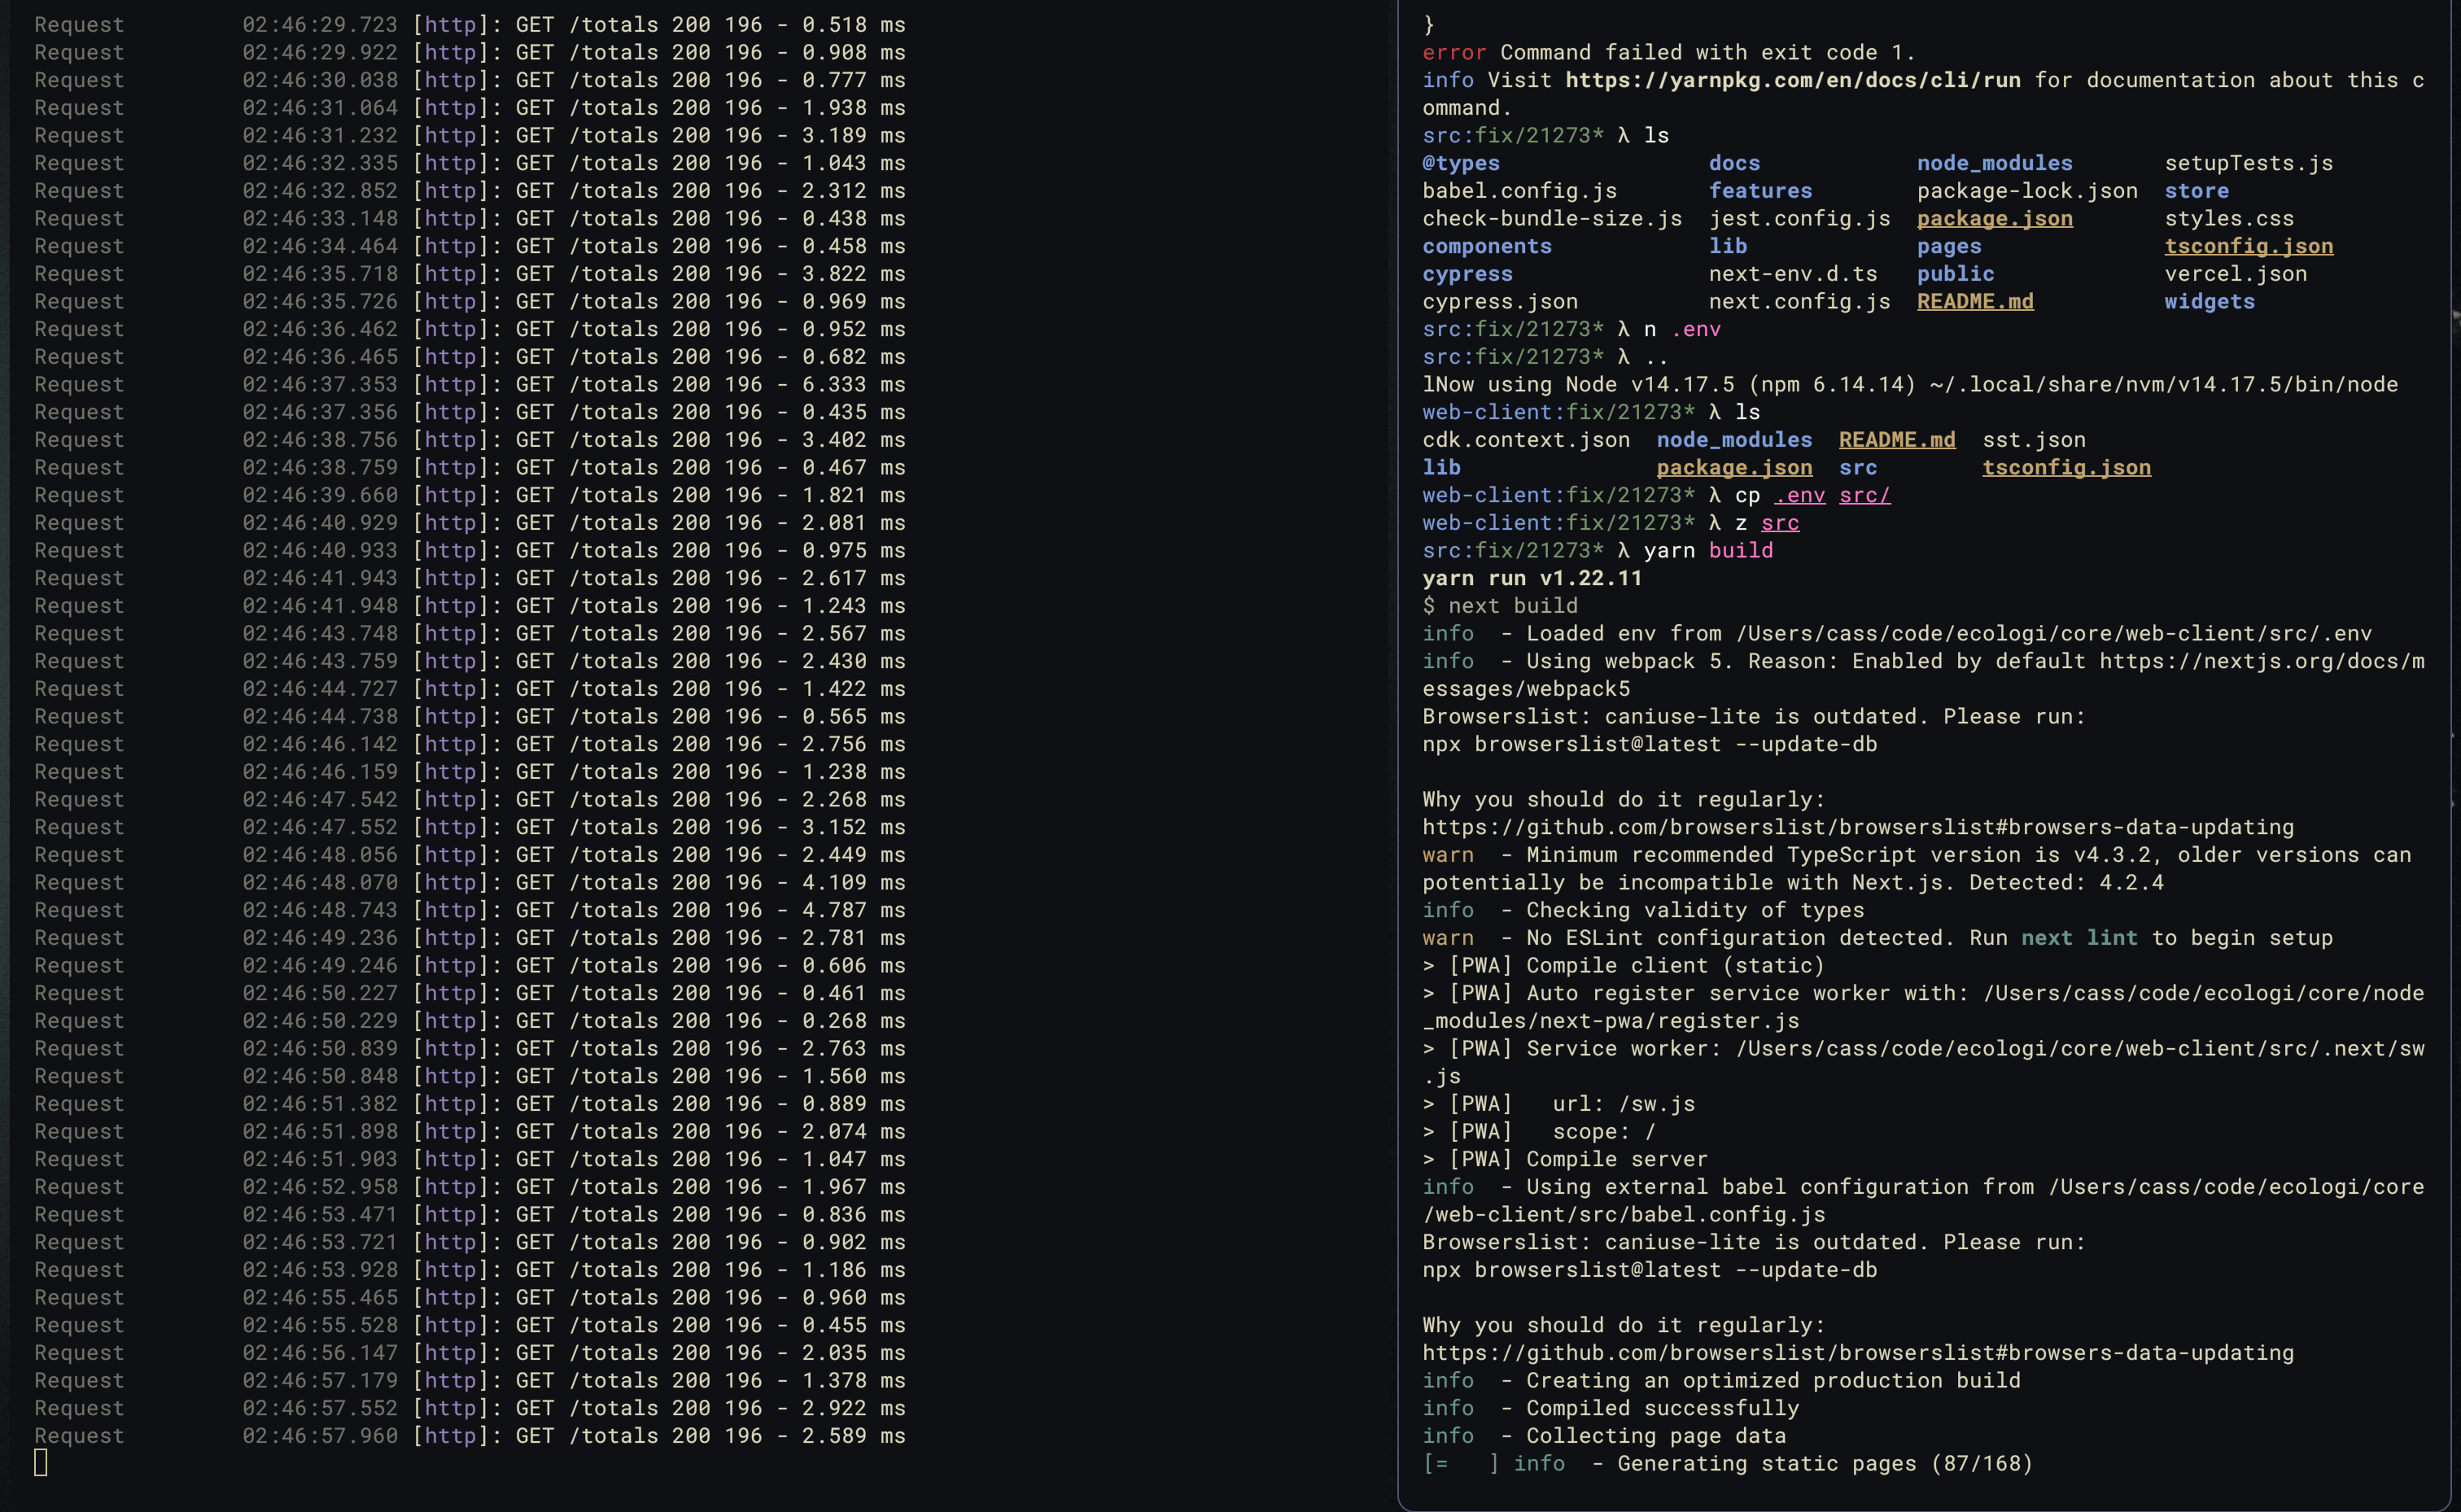
When running a build on the frontend I noticed the API was logging this out:

Hundreds of requests to the /totals endpoint, which is the same endpoint that
performs this big aggregation, the endpoint looked a bit like this:
@UseInterceptors(CacheInterceptor)
@Get()
async countsForAll(): Promise<APIResponse<CountsForAllDto>> {
 // do aggregation query if cache miss on the interceptor
}
The difference in time between all these requests was minuscule, like 0.01s, in a cache miss so we'd have hundreds of these super expensive aggregations running all at the same time which'd cause the CPU to get thrashed on all cores; Mongo falls over and dies, API can't get anything out, all lambdas timeout, website 503s, kittens are crying :(
requests to /totals
|------------->x          miss, cache set for subsequent requests on x
      |---------->        miss
          |---------->    miss
              |-------->  miss
                ...       Repeat this hundreds of times within 0.01s

                     |>   hit
                      |>  hit
                       |> hit

time ------------------ > now
In staging / local development we never had this problem because our data set for the aggregation was significantly smaller than production, this aggregation query would only take 2 seconds vs the 30 seconds in production. The issue is reduced further by the short aggregation time which sets up a cache hit earlier for subsequent requests. Basically the following was happening:
This is doubly worsened by the fact we're using in-memory caching (yeah I know),
and our process manager, pm2, would restart the process on every deployment
causing the cached values to be dumped immediately before the frontend would
then request this data for the build.
Apparently this is called a cache stampede, and the resulting effect congestion collapse.
However, under very heavy load, when the cached version of that page expires, there may be sufficient concurrency in the server farm that multiple threads of execution will all attempt to render the content of that page simultaneously. Systematically, none of the concurrent servers know that the others are doing the same rendering at the same time.
If sufficiently high load is present, this may by itself be enough to bring about congestion collapse of the system via exhausting shared resources. Congestion collapse results in preventing the page from ever being completely re-rendered and re-cached, as every attempt to do so times out.
Thus, cache stampede reduces the cache hit rate to zero and keeps the system continuously in congestion collapse as it attempts to regenerate the resource for as long as the load remains very heavy.
The solution
As a stop-gap I implemented a parallelism limit on this endpoint such that only 1 aggregation pipeline can run at one time (in the wikipedia article this is called Locking), and the rest of the requests are held up waiting until the cache value has been set. A proper solution would be moving us away from an in-memory cache onto Redis or friends & never expiring the cache value / periodically refreshing (external recomputation).
Additionally my solution also only works with a single process running since the lock is also stored in-memory, this whole in-memory cache has multiple knock on problems that I want to resolve post-billing migration... there's not enough hours in the day to address everything all at once :(
aftermath
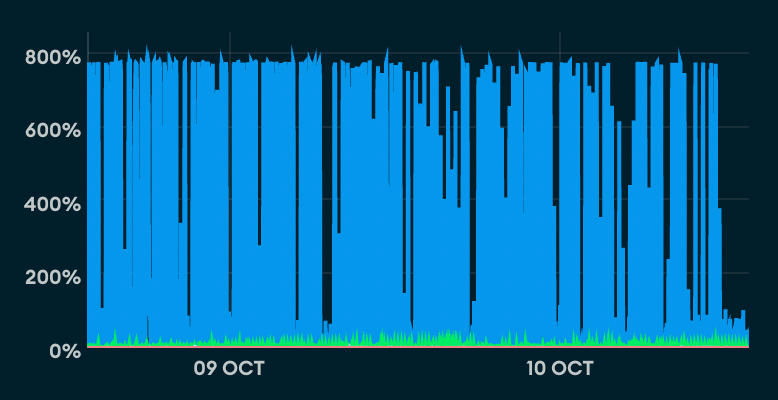
Shortly after my fix going live the 503ing stopped, and the Mongo CPU metrics looked a lot healthier:
 |
 |
|---|
